fbpx
  • Enhancing Revit Workflows with CTC Tools: A Deep Dive into Spreadsheets

    In the modern world of Building Information Modeling (BIM), Excel remains a cornerstone of data management and analysis. Whether it’s for budgeting, scheduling, or data tracking, most professionals are familiar with and rely on Excel’s powerful capabilities. However, when it comes to integrating Excel with complex BIM tools like Autodesk Revit, the process can often be cumbersome and inefficient. This is where CTC’s Spreadsheet Link and Schedule XL come into play. These innovative tools bridge the gap between Excel and Revit, allowing users to harness the best of both worlds. In this post, we’ll delve into how Spreadsheet Link and Schedule XL streamline workflows, enhance data accuracy, and ultimately help you manage your Revit projects with greater efficiency and ease.

    1. Understanding Spreadsheet Link

    What is Spreadsheet Link?

    Spreadsheet Link is a tool developed by CTC that connects Revit with Excel, allowing for seamless data integration between the two platforms. This integration is especially valuable for teams where not everyone uses Revit, as it enables efficient data management and collaboration.

    Key Features

    • Bidirectional Data Sync: Synchronize data between Revit and Excel effortlessly. Updates made in Excel can be reflected in Revit and vice versa.
    • Customizable Templates: Create and use custom Excel templates tailored to your project’s specific needs, ensuring consistency and accuracy.
    • Data Manipulation: Leverage Excel’s advanced data manipulation and analysis capabilities before syncing the updated data back to Revit.

    Benefits

    • Enhanced Collaboration: Easily share an Excel file with team members or stakeholders who do not use Revit. They can update the file with necessary information, which can then be synchronized back into Revit, ensuring everyone stays on the same page.
    • Improved Efficiency: Save time by allowing non-Revit users to handle data updates and modifications in Excel, reducing the need for manual data entry in Revit.
    • Reduced Errors: Utilize Excel’s data validation and formatting tools to minimize errors before syncing data to Revit.

    2. Exploring Schedule XL

    What is Schedule XL?

    Schedule XL is a tool developed by CTC that enhances Revit’s scheduling capabilities by enabling users to import Excel files directly into Revit. This functionality is particularly useful for teams who use Excel for data management and want to integrate that data seamlessly into their Revit projects.

    Key Features

    • Import Excel Files into Revit: Schedule XL allows you to import Excel spreadsheets directly into Revit. This means you can leverage Excel’s powerful data manipulation and formatting features while ensuring your data is accurately reflected in your Revit schedules.
    • Customizable Data Mapping: The tool provides flexible options for mapping data from your Excel file to Revit’s schedule parameters. This customization helps in aligning your Excel data with Revit’s requirements, making the import process smooth and accurate.

    Benefits

    • Enhanced Efficiency: Importing Excel files into Revit with Schedule XL saves time and effort by eliminating the need to manually re-enter data. You can prepare and format your data in Excel and then import it directly into Revit, streamlining your workflow.
    • Improved Accuracy: Excel’s data validation and formatting tools help ensure that your data is correct before it’s imported into Revit. This reduces the risk of errors and discrepancies in your schedules.
    • Simplified Collaboration: Schedule XL facilitates better collaboration by allowing team members who are more comfortable working in Excel to manage and update schedule data. You can easily share Excel files with collaborators and import their updates into Revit without hassle.
    • Flexible Data Management: Leveraging Excel’s features for data manipulation, analysis, and formatting provides greater flexibility in managing complex schedule data. You can perform detailed analyses and apply sophisticated formatting in Excel before bringing the data into Revit.

    3. Integrating Both Tools for Maximum Efficiency

    Combined Benefits

    Using Spreadsheet Link and Schedule XL together can create a powerful workflow where data management and schedule editing are streamlined and more efficient.

    For instance, you can use Spreadsheet Link to manage and update room data in Excel, you can then generate custom Schedules in Excel and then use Schedule XL to handle the corresponding schedules, ensuring consistency and accuracy across your project.

    Workflow Tips

    • Consistent Data Management: Maintain consistency by using Excel for data updates and Revit for design changes.
    • Regular Syncing: Ensure regular syncing between Revit and Excel to keep data current and accurate.

    CTC’s Spreadsheet Link and Schedule XL are indispensable tools for Revit users looking to enhance their workflow, improve data management, and boost overall efficiency. By integrating these tools into your BIM process, you can unlock new levels of productivity and accuracy, ultimately leading to more successful project outcomes.

    For any inquiries, reach out to your sales representative or contact us at info@solidcad.ca. Together, let’s transform how you manage contract administration in Revit and elevate your projects to new heights of success.

    Optimizing Contract Administration in AECO: Utilizing CTC Model Dashboard for Revit

    Effective contract administration is vital for project success in the AECO industry. By leveraging CTC’s powerful plug-ins for Revit, such as the Model Dashboard, you can enhance project visibility and streamline workflows for project leads, senior architects, designers, and BIM managers.

    The Problem: Navigating Revit’s Complexity

    Revit users often grapple with identifying critical project metrics due to several challenges:

    Lack of Visibility: In Revit, project metrics such as the number of in-place families, line style counts, and total warnings are dispersed across the project, making it difficult to obtain a clear overview. Users may remain unaware of numerous instances in the model that require attention.

    Limited Reporting Tools: Revit does not offer built-in tools for comprehensive error reporting on metrics like in-place families, line style counts, and many others.

    Manual Inspection: Identifying project metrics usually involves manual inspection, which is time-consuming and prone to errors. This process makes it challenging to spot every instance that needs correction.

    No Warning System: Revit lacks real-time warnings or notifications regarding project metrics, their impact on performance, or compliance with best practices. Users often do not receive alerts until issues have escalated.

    Limited Documentation: Many Revit projects suffer from insufficient documentation and standards related to project metrics, complicating the enforcement of consistency and error identification.

    Growing Impact: Failure to adhere to project standards and improper modeling workflows, such as the excessive use of in-place families, can lead to performance issues, increased file sizes, and longer load times. These issues accumulate gradually, making them less noticeable initially.

    To overcome these obstacles, Revit users must resort to a mix of manual checks, custom scripts, and third-party tools. Implementing best practices and standards for family usage is crucial in preventing such issues. This is where the CTC Model Dashboard steps in as a comprehensive solution.

    The Solution: CTC Model Dashboard

    The CTC Model Dashboard is an innovative Revit feature designed to enhance project oversight by populating custom parameters within a Revit model with specific metrics. This tool provides a visual presentation of over 30 metrics, offering users a clear snapshot of their project’s health.
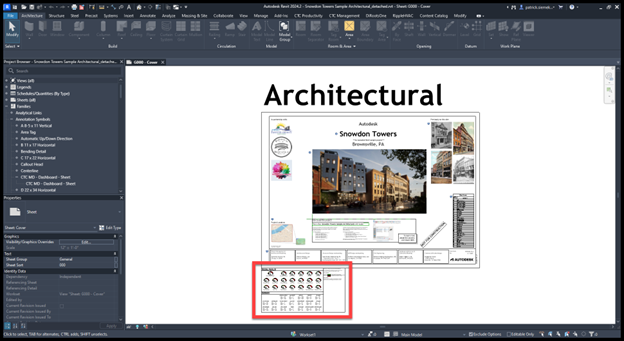
    Key Features:

    • Visibility of Metrics: Place the CTC Model Dashboard titleblock on your Revit “Starting Page” to display project metrics upon opening a model.
    • Customizable: Use the titleblock as-is or customize it to meet your specific needs.
    • Comprehensive Data Collection: Gather 30+ project metrics, including:
      • Open and save times
      • Quantities of placed and unplaced/unused Revit objects
      • Total warnings
      • File sizes
      • Linked elements
      • Worksets
      • Text types, line styles, dimension types
    • Real-Time Updates: Metrics are updated every time a user saves or syncs the Revit model.
    • Proactive Issue Identification: Helps you spot problems early and address them before they escalate.
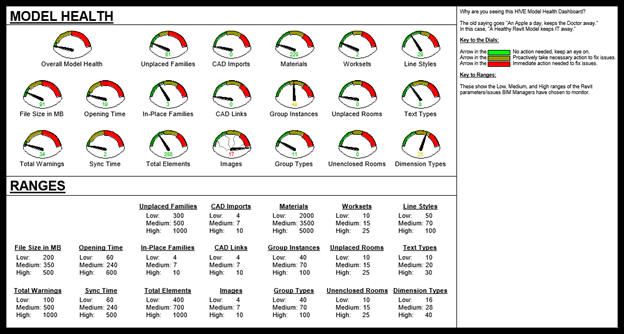
    To utilize the CTC Model Dashboard, a license for the CTC BIM Project Suite is required. This suite includes over 19 premium Revit add-ons, enabling users to streamline repetitive tasks, analyze modeling scenarios, extract model data, and much more efficiently within the Revit environment.

    Partnering with SolidCAD

    At SolidCAD, we are more than just software providers; we are your partners in achieving excellence in contract administration. Our team of experts is here to guide you in effectively deploying the CTC Model Dashboard and other CTC plug-ins, ensuring you gain the maximum benefit from these tools. We offer tailored consulting services to help you integrate these solutions seamlessly into your workflows, enhancing your project’s performance and efficiency.

    For any inquiries, reach out to your sales representative or contact us at info@solidcad.ca. Together, let’s transform how you manage contract administration in Revit and elevate your projects to new heights of success.
    Autodesk Desktop Connector

    Version 16.9 of the ADC is now available to download. You can find information about it and download it from this link.

    If you’re upgrading from 15.x, it would be best that you read this document as there have been significant changes.

    In addition to the usual performance and defect fixes, probably the most important new feature is this:

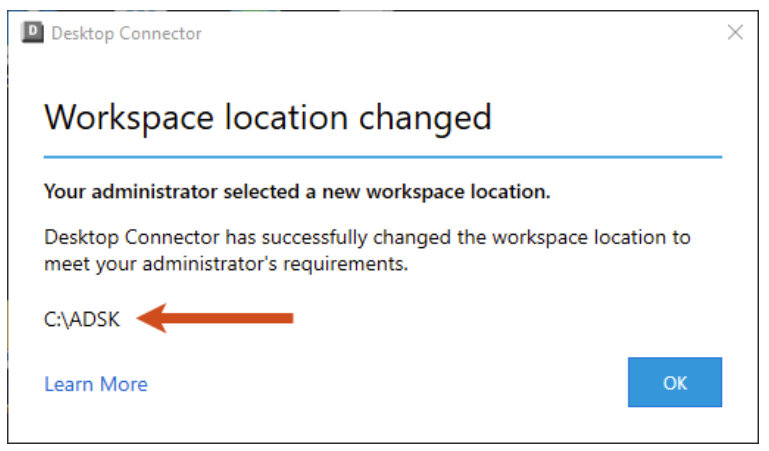
    Administrators now have the ability to set the local workspace location during install/deployment of Desktop Connector. This capability allows admins to enforce a company standard workspace. (CDX-24152)

    For any questions reach out to your sales rep or contact us at info@solidcad.ca

    Civil 3D: Subassembly Composer Tip of the Year

    Good day folks, do we have a tip for you today! If you create custom subassemblies with the Subassembly Composer, you’ll want to read on…

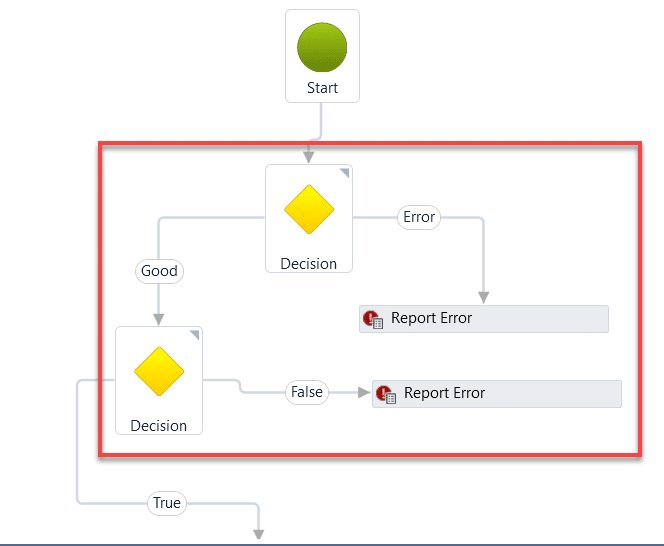
    I’ve created maybe a couple hundred subassemblies for myself and various customers over the years. Some easy and some very involved. In nearly all of them, I’ve wanted to move all or some of the nodes in the flowchart. In this example, I need to move the nodes within the red rectangle.

    It sounds easy, and it is, but only if you know the trick. And many thanks go to my colleague Jae Kwon for pointing this out to me today. Where were you 6 years ago?


    Multiple nodes can be selected by holding the CTRL button while selecting nodes but only one moves.

    Here is the key:

    1. Double click in a blank area. It doesn’t seem to matter where, just double click somewhere, say close to the X in the image.

    2. Select the nodes you’d like to move by holding CTRL and picking them with your mouse. To move all, CTRL+A.

    3. Use the arrow keys (not the mouse) to move them.

    That’s it. Enjoy.

    For any questions reach out to your sales rep or contact us at info@solidcad.ca

    Civil 3D 2025

    Well, it’s that time of year again when Autodesk bestows us with the latest release of their flagship Civil Design application. Read on to see which features speak to this blogger.

    File Format

    This is probably the most-asked question, and I’m happy to say that there is yet again, no format change. We are still on the 2018 format. Good news for everyone!

    Performance

    Performance has yet again been significantly improved across the board in Civil 3D 2025.0.

    Corridors

    There is a new corridor creation dialog box that will allow for more efficient creation of corridor with multiple baselines using alignments and feature lines.

    Civil 3D 2025

    Civil 3D 2025Civil 3D 2025

    Coordinate Systems

    New horizontal coordinate systems have been provided.

    A new vertical coordinate system workflow exists to specify the survey datum. The new command is GEOCSASSIGN.

    Another new system variable named, ENABLEVCSSUPPORT, exists for DEM/GeoTIF files.

    Civil 3D 2025

    Surfaces

    Level of detail tools are intended to increase performance by reducing the amount of data displayed on the screen. Note that in 2025.0 ,two previous commands have been removed: LEVELOFDETAIL and LEVELOFDETAILOFF. These are replaced by object-based settings.

    Civil 3D 2025Civil 3D 2025

    For any questions reach out to your sales rep or contact us at info@solidcad.ca

    AutoCAD 2025

    Well, it’s that time of year again when Autodesk bestows us with the latest release of their flagship drafting application. Here is the Official Documentation. Read on to see which features speak to this blogger.

    File Format

    This is probably the most-asked question, and I’m happy to say that there is yet again, no format change. We are still on the 2018 format. Good news for everyone!

    Activity Insights

    More actions are being logged into the Insights.

    If you use the DWG History tools, these have been merged with Activity Insights. Note: the history is now only available within the Insights palette. The DWGHISTORY command no longer exists, though the functionality is still there.

    AutoCAD 2025

    AutoCAD 2025

    Markups

    Markups from Autodesk Docs are now supported.

    Assigning specific annotation styles is now possible.

    Polygonal revision clouds are supported.

    Comments attached to markups are selectable.

    Hatch

    This one is pretty cool! Draw a new hatch object without creating or specifying a boundary. E.g. use the new hatch rectangle command to quickly create a hatch. Not limited to rectangles; any shape is possible.

    A new hatch path option is available. This creates a hatch of a specified width along a path, like a polyline.

    AutoCAD 2025

    Blocks

    AutoCAD can use machine learning to detect linework and convert that linework to a block. Imagine a drawing where all the door blocks were exploded. You would prefer that they had not been. Use the new command to identify those door lines and convert them to a block

    AutoCAD 2025      AutoCAD 2025

    ESRI Maps

    ESRI maps are now integrated into AutoCAD. Now, you can use five additional types of Esri maps to assign geographic location information to a drawing file.


    AutoCAD 2025

    AutoCAD 2025

    For any questions reach out to your sales rep or contact us at info@solidcad.ca

    Civil 3D: Object Names and Style Descriptions

    Does your company require the use of a specific naming convention for Civil 3D objects? Has it been difficult to adhere to that standard? If so, read on for some tips.

    When an object is created in Civil 3D, it requires a name. This is the naming convention for a new alignment using the out of the box Civil 3D drawing template. It will be named Alignment – (1), the next one will be Alignment t – (2), etc. This name is not very descriptive, and I hope you’re using something better than this already!

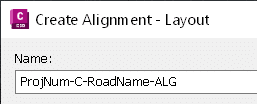
    Here is an example of a company’s strict naming convention.

    1234-C-Granville-ALG

    • 1234                     =             project number
    • C                            =             civil
    • Granville              =             road name
    • ALG                       =             alignment

    Users must refer to a naming standard, often a PDF document somewhere on the network, and this can take time. Under pressure, users sometimes skip the formalities and use a non-standard name. We must make it as easy and fast as possible for them.

    Why not embed this standard into the drawing template itself so users won’t need to open another file? Here is how this could be done directly in your Civil 3D drawing template. The users’ responsibilities would be to edit the mixed-caps data and leave the ALL CAPS data.

    Prompting the user with the information they need when they need it will help to ensure better efficiency and (potentially more important) reduce the chance that they use non-standard names. This can be done for all relevant Civil 3D objects in the Settings tab by:

    • Editing the Feature Settings for the object in question.

    • Configuring the name template.

    • Clearing any child overrides so all alignments get named properly regardless of the command used.


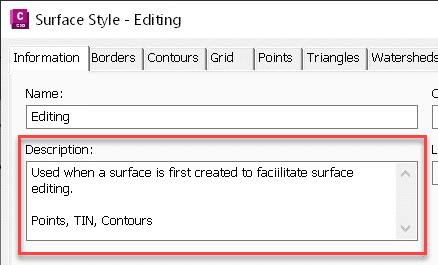
    While we’re on the subject, it can be beneficial to include a good description with styles so that users are prompted when or why to use a style. I try not to have make the description so long that my users need to scroll to see the entire thing. They won’t! Make it concise.

    Civil 3D: 2024.3 Update

    Civil 3D 2024 has a new update: 2024.3. You can use Autodesk Access to install it or download it from your Autodesk page.

    Here are the notable enhancements.

    Civil 3D: 2024.3 Update

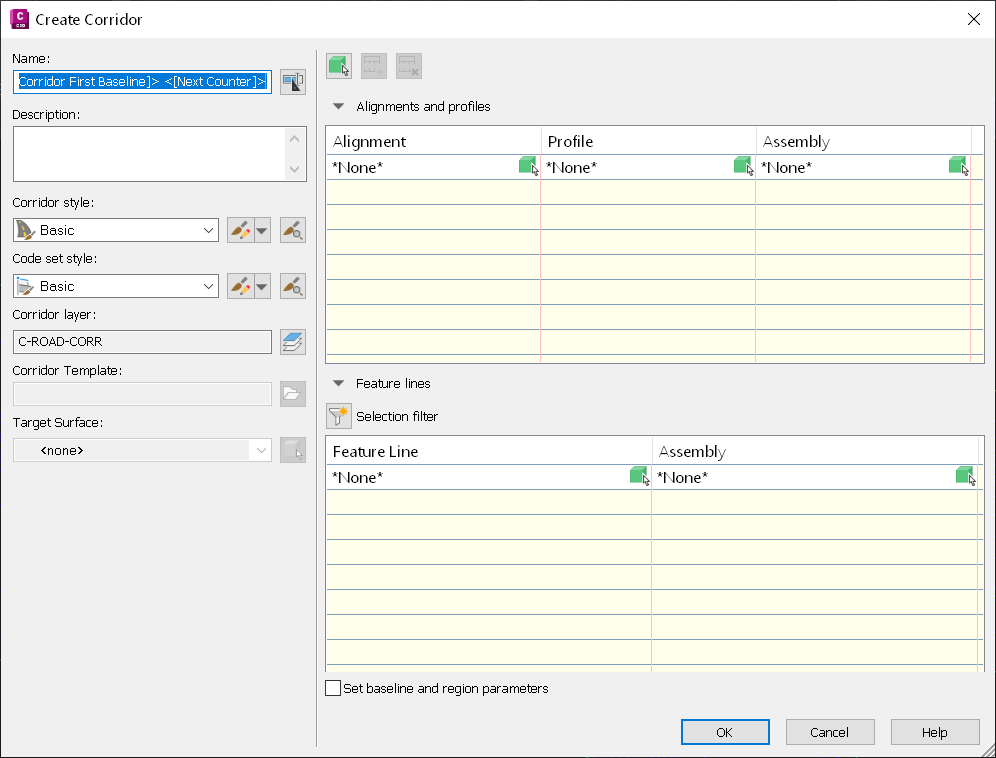
    • When creating a new corridor, expect to see this new dialog. It allows for the creation of multiple baselines right at the time of corridor creation. For large corridors, this could be a significant time saver.
    • In that same new dialog, feature lines can be more efficiently chosen by filtering based on criteria such as Name, Style, Layer, and Site.
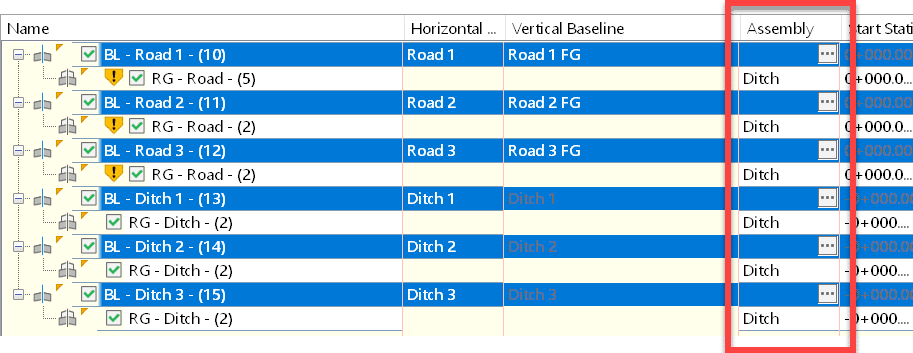
    • Assign alternate assemblies in Corridor Properties for multiple baselines and regions simultaneously.

    Civil 3D: 2024.3 Update

    • The Dynamo Core has been updated to version 2.19. Note, that this can cause issues with Dynamo scripts created prior to 2.19…
      “if you have no nodes set as “Output”, nor a Slider or Boolean Input, it will never show your Inputs in the Dynamo Player.”
      “Adding a node as an Output will “solve” this issue”

    In the API, Added the ability to call the API to export C3D objects to the ArcGIS FileGeodatabase to automate workflows from C3D to ArcGIS.

    Mastering Point Clouds in Civil 3D: A Three-Part Guide to Efficiency: Bonus Part

    This is a bonus article in the Point Cloud series. Click to view: 

    Article 1 

    Article 2 

    Article 3 

    With all this talk about decimation and removing many of those original points in the cloud, how does one know if they’ve removed too many points? Here is how I do it. 

    • Insert the point cloud into Civil 3D.
    • Make a surface from the original point cloud, but only a small subset, so it’s not too big.

    • Make a surface from the decimated classification using the same red border as above. This so you can tell how many points are used for each surface within that area. 
    • Make an alignment and profile sampling both surfaces and have a look. The blue is the original, the red is the decimated cloud. Some of it is bang on and some of it isn’t. You get to decide if you have decimated too much.

    Are there any other ways to decimate that are better? VRMESH and Pix4D are expensive applications that do this, but I have limited experience with them. Civil 3D, however, has one more trick up its sleeve. 

    • Make a new surface and paste the original point cloud surface into it. Yes, the big one, but remember that it’s only using the points within the red border. 
    • Use the Simplify Surface editing tool. The highlighted number is where you can experiment. The bigger the number, the more points will be removed.

    • Sample this new surface in the profile view with the other 2 and compare. The purple profile was created with this new surface. That surface contains about the same number of points as the one created using the decimated cloud from Recap. It is closer to the original.

    What does this mean? Is Civil 3D’s Simplify Surface tool better than Recap’s “Intelligent Decimation”? In my experience, I find that yes, it can give me a better result. But not always. Even in this same dataset, there are areas where the decimated cloud is closer to the original. The red line below. 

    Here is my philosophy. This works best for me. Your mileage may vary depending on your point cloud. 

    1. If a cloud has 80 million points, it is more efficient to decimate it using Recap before it ever comes into Civil 3D. 
    1. Decimate in Recap, but maybe not as much as you would like. E.g., if I think  1 million points is the right number for my Civil 3D surface, I will decimate to 2 or 3 million. 
    1. After modeling the surface, use the Simplify tool to get the surface down to that 1-million-point mark, or whatever your intended number is. 

    Click here to download the sample files. 

    Mastering Point Clouds in Civil 3D: A Three-Part Guide to Efficiency: Part 3

    Most survey and design firms these days rely on point cloud data to some degree. It is often faster, easier, and safer to survey using aerial or ground-based scanners compared with traditional survey methods. 

    “But these clouds clog up my Civil 3D drawing when I make a surface.” You say. I’m here to tell you that they don’t have to! The dataset is always huge, tens or even hundreds of millions of points. When the deliverable is a surface model in Civil 3D, 3 things must happen. 

    This is the third and final in a series of three articles outlining how Autodesk Recap and Civil 3D are used to carry out these tasks. Click here for the first article in this series. Click here for the second. 

    Task 3: Import to Civil 3D and model a surface. You may already know this step, but since Recap has been used to classify and decimate the points, there is a new task in Civil 3D. 

    Once the point cloud has been attached, all the points will show, and it seems logical to go here and ensure that ONLY the decimated points (Key) are visible so we can model the surface using only those points. 

    Yes, only the Key points are visible, but when we try to model the surface, Civil 3D is using all 15 million of them, not the 10,000 that was specified during the decimation process. Autodesk is aware of this “defect”. When or if it will be rectified is unknown. 

    But don’t fret, there is a workaround. 

    Turn on the map Workspace (MAPWPACE) and create a new layer from the point cloud. 

    Filter the Key points in that new layer. 

    Then create the surface normally. Only the Key points will be used. 

    Stay tuned for the BONUS article… Yes, you read that right. There is one more.