fbpx
  • Enhancing Revit Workflows with CTC Tools: A Deep Dive into Spreadsheets

    In the modern world of Building Information Modeling (BIM), Excel remains a cornerstone of data management and analysis. Whether it’s for budgeting, scheduling, or data tracking, most professionals are familiar with and rely on Excel’s powerful capabilities. However, when it comes to integrating Excel with complex BIM tools like Autodesk Revit, the process can often be cumbersome and inefficient. This is where CTC’s Spreadsheet Link and Schedule XL come into play. These innovative tools bridge the gap between Excel and Revit, allowing users to harness the best of both worlds. In this post, we’ll delve into how Spreadsheet Link and Schedule XL streamline workflows, enhance data accuracy, and ultimately help you manage your Revit projects with greater efficiency and ease.

    1. Understanding Spreadsheet Link

    What is Spreadsheet Link?

    Spreadsheet Link is a tool developed by CTC that connects Revit with Excel, allowing for seamless data integration between the two platforms. This integration is especially valuable for teams where not everyone uses Revit, as it enables efficient data management and collaboration.

    Key Features

    • Bidirectional Data Sync: Synchronize data between Revit and Excel effortlessly. Updates made in Excel can be reflected in Revit and vice versa.
    • Customizable Templates: Create and use custom Excel templates tailored to your project’s specific needs, ensuring consistency and accuracy.
    • Data Manipulation: Leverage Excel’s advanced data manipulation and analysis capabilities before syncing the updated data back to Revit.

    Benefits

    • Enhanced Collaboration: Easily share an Excel file with team members or stakeholders who do not use Revit. They can update the file with necessary information, which can then be synchronized back into Revit, ensuring everyone stays on the same page.
    • Improved Efficiency: Save time by allowing non-Revit users to handle data updates and modifications in Excel, reducing the need for manual data entry in Revit.
    • Reduced Errors: Utilize Excel’s data validation and formatting tools to minimize errors before syncing data to Revit.

    2. Exploring Schedule XL

    What is Schedule XL?

    Schedule XL is a tool developed by CTC that enhances Revit’s scheduling capabilities by enabling users to import Excel files directly into Revit. This functionality is particularly useful for teams who use Excel for data management and want to integrate that data seamlessly into their Revit projects.

    Key Features

    • Import Excel Files into Revit: Schedule XL allows you to import Excel spreadsheets directly into Revit. This means you can leverage Excel’s powerful data manipulation and formatting features while ensuring your data is accurately reflected in your Revit schedules.
    • Customizable Data Mapping: The tool provides flexible options for mapping data from your Excel file to Revit’s schedule parameters. This customization helps in aligning your Excel data with Revit’s requirements, making the import process smooth and accurate.

    Benefits

    • Enhanced Efficiency: Importing Excel files into Revit with Schedule XL saves time and effort by eliminating the need to manually re-enter data. You can prepare and format your data in Excel and then import it directly into Revit, streamlining your workflow.
    • Improved Accuracy: Excel’s data validation and formatting tools help ensure that your data is correct before it’s imported into Revit. This reduces the risk of errors and discrepancies in your schedules.
    • Simplified Collaboration: Schedule XL facilitates better collaboration by allowing team members who are more comfortable working in Excel to manage and update schedule data. You can easily share Excel files with collaborators and import their updates into Revit without hassle.
    • Flexible Data Management: Leveraging Excel’s features for data manipulation, analysis, and formatting provides greater flexibility in managing complex schedule data. You can perform detailed analyses and apply sophisticated formatting in Excel before bringing the data into Revit.

    3. Integrating Both Tools for Maximum Efficiency

    Combined Benefits

    Using Spreadsheet Link and Schedule XL together can create a powerful workflow where data management and schedule editing are streamlined and more efficient.

    For instance, you can use Spreadsheet Link to manage and update room data in Excel, you can then generate custom Schedules in Excel and then use Schedule XL to handle the corresponding schedules, ensuring consistency and accuracy across your project.

    Workflow Tips

    • Consistent Data Management: Maintain consistency by using Excel for data updates and Revit for design changes.
    • Regular Syncing: Ensure regular syncing between Revit and Excel to keep data current and accurate.

    CTC’s Spreadsheet Link and Schedule XL are indispensable tools for Revit users looking to enhance their workflow, improve data management, and boost overall efficiency. By integrating these tools into your BIM process, you can unlock new levels of productivity and accuracy, ultimately leading to more successful project outcomes.

    For any inquiries, reach out to your sales representative or contact us at info@solidcad.ca. Together, let’s transform how you manage contract administration in Revit and elevate your projects to new heights of success.

    Optimizing Contract Administration in AECO: Utilizing CTC Model Dashboard for Revit

    Effective contract administration is vital for project success in the AECO industry. By leveraging CTC’s powerful plug-ins for Revit, such as the Model Dashboard, you can enhance project visibility and streamline workflows for project leads, senior architects, designers, and BIM managers.

    The Problem: Navigating Revit’s Complexity

    Revit users often grapple with identifying critical project metrics due to several challenges:

    Lack of Visibility: In Revit, project metrics such as the number of in-place families, line style counts, and total warnings are dispersed across the project, making it difficult to obtain a clear overview. Users may remain unaware of numerous instances in the model that require attention.

    Limited Reporting Tools: Revit does not offer built-in tools for comprehensive error reporting on metrics like in-place families, line style counts, and many others.

    Manual Inspection: Identifying project metrics usually involves manual inspection, which is time-consuming and prone to errors. This process makes it challenging to spot every instance that needs correction.

    No Warning System: Revit lacks real-time warnings or notifications regarding project metrics, their impact on performance, or compliance with best practices. Users often do not receive alerts until issues have escalated.

    Limited Documentation: Many Revit projects suffer from insufficient documentation and standards related to project metrics, complicating the enforcement of consistency and error identification.

    Growing Impact: Failure to adhere to project standards and improper modeling workflows, such as the excessive use of in-place families, can lead to performance issues, increased file sizes, and longer load times. These issues accumulate gradually, making them less noticeable initially.

    To overcome these obstacles, Revit users must resort to a mix of manual checks, custom scripts, and third-party tools. Implementing best practices and standards for family usage is crucial in preventing such issues. This is where the CTC Model Dashboard steps in as a comprehensive solution.

    The Solution: CTC Model Dashboard

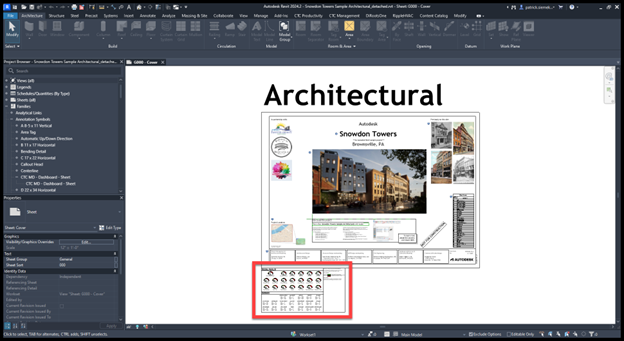
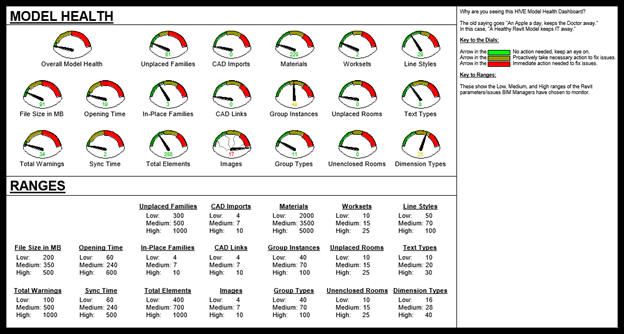
    The CTC Model Dashboard is an innovative Revit feature designed to enhance project oversight by populating custom parameters within a Revit model with specific metrics. This tool provides a visual presentation of over 30 metrics, offering users a clear snapshot of their project’s health.

    Key Features:

    • Visibility of Metrics: Place the CTC Model Dashboard titleblock on your Revit “Starting Page” to display project metrics upon opening a model.
    • Customizable: Use the titleblock as-is or customize it to meet your specific needs.
    • Comprehensive Data Collection: Gather 30+ project metrics, including:
      • Open and save times
      • Quantities of placed and unplaced/unused Revit objects
      • Total warnings
      • File sizes
      • Linked elements
      • Worksets
      • Text types, line styles, dimension types
    • Real-Time Updates: Metrics are updated every time a user saves or syncs the Revit model.
    • Proactive Issue Identification: Helps you spot problems early and address them before they escalate.

    To utilize the CTC Model Dashboard, a license for the CTC BIM Project Suite is required. This suite includes over 19 premium Revit add-ons, enabling users to streamline repetitive tasks, analyze modeling scenarios, extract model data, and much more efficiently within the Revit environment.

    Partnering with SolidCAD

    At SolidCAD, we are more than just software providers; we are your partners in achieving excellence in contract administration. Our team of experts is here to guide you in effectively deploying the CTC Model Dashboard and other CTC plug-ins, ensuring you gain the maximum benefit from these tools. We offer tailored consulting services to help you integrate these solutions seamlessly into your workflows, enhancing your project’s performance and efficiency.

    For any inquiries, reach out to your sales representative or contact us at info@solidcad.ca. Together, let’s transform how you manage contract administration in Revit and elevate your projects to new heights of success.

    Why you should replace your AutoCAD/Civil 3D Tool Palettes with Hive CMS libraries

    As an organization grows, it will navigate through projects of different size and nature. Rules and structures need to be fixed, and when managing engineering data comes into play, engineering and production standards need to be applied.  

    Within AutoCAD and Civil 3D, an engineering firm, a contractor or a government agency will gather standards through templates, support files, specific symbology for lines, blocks and infrastructure representations (Civil 3D styles and Labels).  

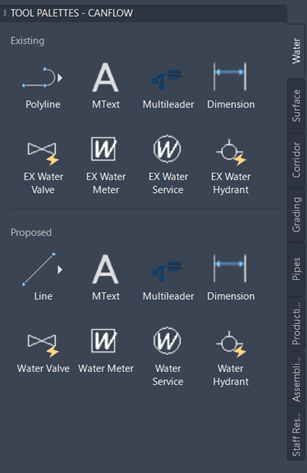
    The closest thing out-of-the-box to a user-friendly interface to structure these standards is a Tool Palette: 

    AutoCAD Civil 3D

    Pros of using a Tool Palette: 

    • Drag-and-dropping objects in the tool palette is an easy way to bring in some content (mainly AutoCAD but limited to assemblies for Civil 3D).  
    • Buttons can launch complex commands, scripts and lisp routines. 

    Cons of using a Tool Palette: 

    • Limited in terms of Civil 3D objects integration. 
    • Launching “non-AutoCAD” files from the command demands complex command buttons, with proper mapped drive on a server (i.e.: Word/PDF documents containing design standards shared to the whole Team) and are near impossible to launch from a cloud data connector (i.e.: OneDrive, Google Drive, and even Autodesk Construction Cloud). 
    • No search engine is available to sift through growing amounts of standards, commands and files that could scale up with your growing organization as time goes on. 
    • Deployment across an organization is extremely complex, due to Tool Palette “obscure” ties in a user profiles and file structure. Same goes for updating your standards over time. 

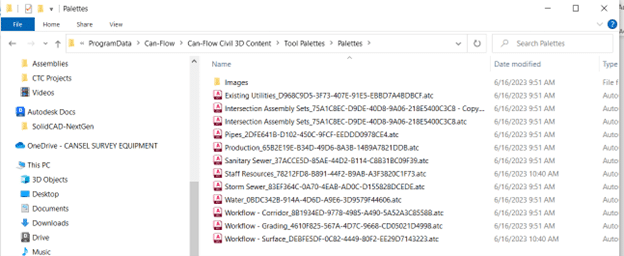
    For example, here’s the first level of Tool Palettes file’s structure: 

    AutoCAD Civil 3D

    And here’s the second level of Tool Palettes file’s structure: 

    AutoCAD Civil 3D

    Hive CMS is a desktop application that will solve these issues, leveraging a cloud system to easily share your CAD standards and design files (AutoCAD, Civil 3D and non-drawing-based files).  

    Developed by CTC Software, Hive supports organizations to share content via a cloud platform, completely compatible with supported versions of AutoCAD and Civil 3D. Among the different types of shareable content, you will find: 

    • AutoCAD Blocks, 
    • AutoCAD/Civil 3D Commands (handling all other kind of object creation and more), 
    • Civil 3D object styles and labels, 
    • Civil 3D assemblies, 
    • Templates, 
    • Lisp routines and script files, 
    • Non-drawing-based files (basically every other types of files like Office files, PDF, PKT, and so forth). 

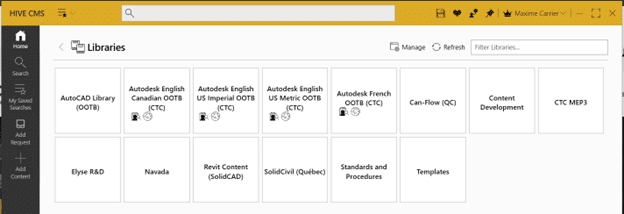
    Hive stores these elements in libraries, as shown in the Hive CMS main interface: 

    AutoCAD Civil 3D

    And then browsing through the different libraries your organization WANTS you to see and work with. 

    AutoCAD Civil 3D

    As you are connecting in your CTC account, Hive CMS filters what shareable content your CTC Account administrator has given you access to.  Depending on the “contribution” level you have access to, you can add, manage and assign “tags” that are basically extra metadata that will help your team search and filter through your shared content. 

    Here’s some tags as an example: 

    AutoCAD Civil 3D

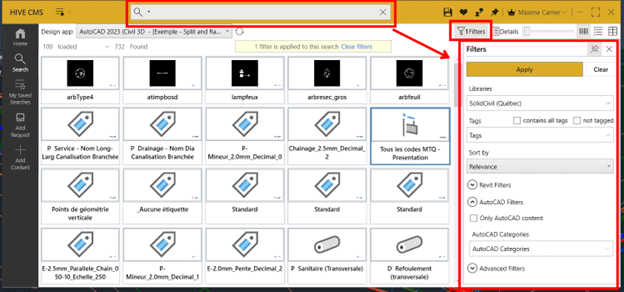
    The search engine from Hive CMS is extremely powerful, helping you sift through your organization ever-changing and ever-growing standards. The Filter menu allows you to do some advanced search using content name and metadata, and even save it for further uses (for you or for your entire organization). 

    AutoCAD Civil 3DT

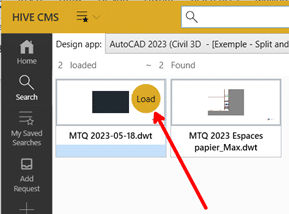
    o use a piece of content, just click it from the Hive CMS interface and it will launch in your currently opened drawing or will add itself to your current drawing (for Civil 3D styles and labels), ready to be used. 

    To launch a file, like a new drawing from a template or opening a PDF document in your default application, just click it from your library: 

    AutoCAD Civil 3D

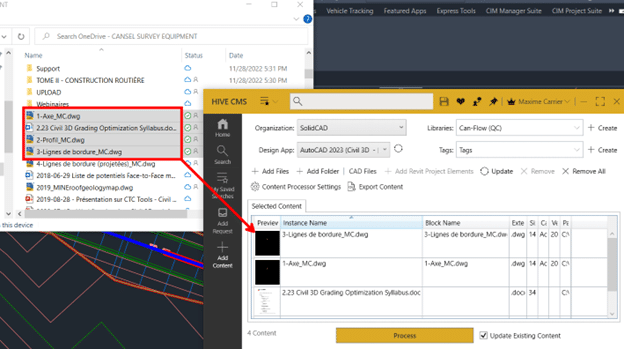
    While there are some subtilities to upload content to your libraries (not covered in this blog), uploading files in Hive CMS is done as easily as drag-and-dropping your files from Windows File Explorer to the “Add content” tabular editor, assigning a Library (and appropriate Tags) and clicking the Process button. 

    AutoCAD Civil 3D

    In conclusion, the Hive system will help your organization to better support your CAD and Civil teams with scalable tools that are easily shared and covering any needs you want from a custom user interface, a custom Tool Palette and so much more. Hive makes your standard deployment easier, safer and way more user-friendly for everyone involved (administrators, superusers and users alike). 

    Civil 3D: Grading Optimization Problem

    Civil 3D: Grading Optimization Problem

    Do you have an issue displaying the Grading Optimization (GO) window with Civil 3D 2022.1 and GO 2022.2?  If so, read on.

    I have been working with GO since it arrived, but when I installed the Civil 3D 2022.1 and GO 2022.2 updates, GO failed to display once I click “Optimize”.  The windows actually appear, but only the shadow edge.


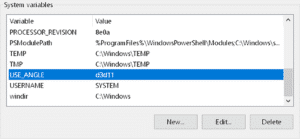
    Autodesk is working on a public fix, but they asked me to try this, and it worked.  Create a new Windows Environment variable with this name and value.

    Variable:              USE_ANGLE

    Value:                  d3d11

    Civil 3D: PPK Extension

    Many of our customers desire the ability to transform Civil 3D data between coordinate systems.  This was challenging or impossible…until now!  Read on…

    It is available for Civil 3D 2019-2022.  Read more about this extension here.

    The Autodesk® PPK Survey Extension 2022 for Civil 3D® provides an interface for importing GPS data (in RINEX format) for analysis, reporting, and converting it to coordinate geometry points in an Autodesk Civil 3D drawing. Once installed, users can access the Autodesk PPK Survey Extension 2022 for Civil 3D commands via the Autodesk Civil 3D Toolbox.

    Under COGO Points Transformation Tools:

    • Coordinate System Transformation
    • Vertical Datum Transformation

    Under GNSS Data Processing:

    • Post Process Kinematic Survey

    Earthworks Processor Alternative Use Cases – Mapping Borehole Information

    Earthworks Processor is a great tool in the CTC CIM Project suite for automating hours of surface creation and manipulation for the purpose of calculating dynamic and accurate earthworks quantities. With the use of a finished grade surface, existing grade surface, and simple closed polyline “regions”, Earthworks Processor will create 6 different surfaces including a stripping surface, earthworks volumes surface, and a subgrade surface. As well as offer bound volume outputs in the form of tables and labels.  

    Today I want to talk about an alternative use for EWP. A dynamic way to calculate volumes and map profiles of points of interest from borehole data. This data could be anything from tops or bottoms of contaminant plumes to bedrock mapping, to volumes of loam that cannot be used for backfill. Borehole data of such points of interest is generally represented in depths from the existing surface, not elevations, and it can be tedious to get correct elevations mapped out.  

    EWP only requires the existing surface and some closed regions identifying depths of the unsuitable backfill (in this case). I have mapped this out as depth contours in the capture below. 

    These depth contours are derived from the borehole data, but without manually calculating, there is no efficient way to turn these depths into true elevations.

    EWP can take these depths and run them through its processing to produce surfaces relative to the varying elevations of the existing surface as well as get you accurate volumes that will be dynamically updated as new borehole information is added to the design. In this scenario it’s the polyline region with the depth of 0 (or the extents of the unsuitable fill) that will give us the volume of unsuitable fill that we are looking for.

    This whole process from mapped estimated depth contour polylines to dynamic volumes and surfaces is about 5 mins. The power and ROI of EWP is even more apparent when additional borehole information is added. Depth contours are modified, and EWP is rerun, and surfaces and volumes are updated in seconds.

    I would like to acknowledge Jae Kwon, another Civil Technical Consultant on our SolidCAD team for this alternative EWP workflow. I hope this blog post earned your time today and helps you save time on future projects as well.


    CIM Project Suite 22.0.3 Released

    We are pleased to announce that our partner CTC Software released Civil 3D CIM Project Suite, version 22.0.3. It is now released and can be accessed on the CTC website.

    Below are release notes:

    22.0.39/17/2021CIM Project SuiteAuto GraderBug FixFixed an issue where “split points” in parent feature lines were causing an error. Fixed an issue where creating parallel child lines with a specified station range caused unexpected results. Fixed an issue where inward and outward offsetting was giving unexpected results. Fixed an issue where perpendicular child feature lines were not creating at the user-defined station values. Misc. user interface improvements.
    22.0.39/17/2021CIM Project SuiteCorridor MapperBug FixFixed an issue where corridors with disabled regions were causing the app to fail. Fixed an issue in how the app dealt with corridors containing previously mapped targets.
    22.0.39/17/2021CIM Project SuiteCorridor SplitterNew FeaturesAdded interactive region selection and graphical highlighting, providing a much more intuitive app workflow.
    22.0.39/17/2021CIM Project SuiteEarthwork ProcessorBug FixFixed an issue where the region offset command would not work on very small region objects.
    22.0.39/17/2021CIM Project SuiteLabel GenieBug FixFixed an issue where pipe networks could no longer be labelled.
    22.0.39/17/2021CIM Project SuitePipe PlannerBug FixFixed an issue where part elevations were not updating in the app after applying changes to the drawing. Fixed an issue where part elevations were not updating when importing external spreadsheets. Fixed an issue where pipe lengths for the pipe depth at interval property were not calculating correctly. Fixed an issue where parts of the same name, but in different pipe networks, were not allowed by the app. Fixed an issue where the structure rotation angle was incorrectly rounding.

    15 time-saving labeling shortcuts with CTC’s Label Genie (Part 1)

    Label Genie can save you a ton of time by creating all sorts of useful labels quickly. Here’s 15 examples that you can use right now.

    Descriptions of the settings are included, but to really get up and running quickly Label Genie template files and the sample DWGs have been made available as well. Simply copy the .lg files into %AppData%\CTC\Label Genie then open up Label Genie. They will then show up in the dropdown box in the Label Genie template section.

    If the labels you are creating are for design purposes, you may want to set their layers to a non-plotting style that you can ignore, or a layer that you can just freeze without affecting others.

    Labelling for Corridor Design (*Corridor Design.dwg)

    1.      Label Assemblies (*Assembly Name.lg)

    Make it easier to which assembly is which at a glance by label their names. The labelling is done with a field, so that if the assembly name changes, a simple regen will update the label.

    • Type = Multiline Text
    • Anchor Object = Assemblies (Layer filter = *)
    • Formatting, contents = (Assemblies).(Name)
    • Formatting, Y offset = -4

    2.      Label Alignment Names (*Alignment Name.lg)

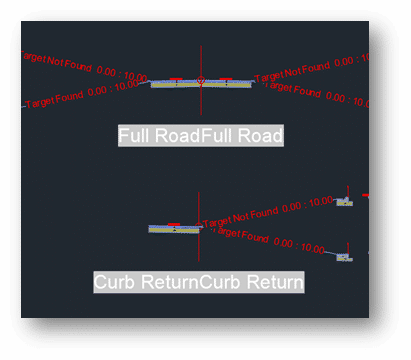
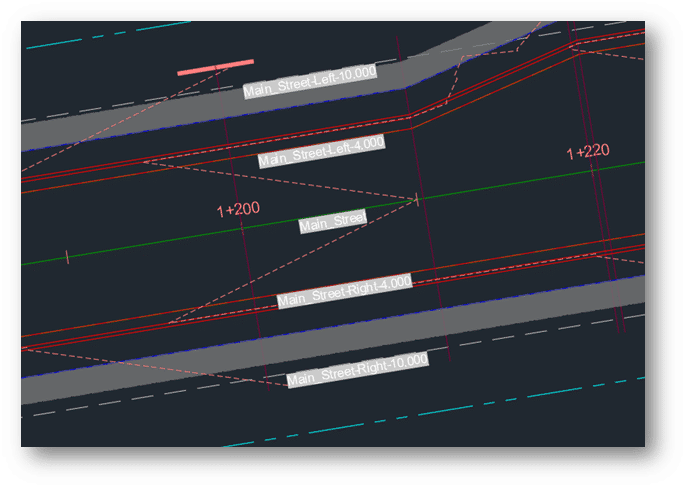
    When doing corridor work, we may want to see alignment names at a glance. This is especially true if setting up a lot of labels with the Corridor Mapper, for instance. Label the alignment names at regular intervals, oriented with the lines to avoid having to check the property palette constantly.

    • Label Type = Multiline Text
    • Anchor Object = Alignments (Layer filter = *)
    • Anchor Point = Vertices (Interval = 100, rest unchecked)
    • Formatting, contents = (Alignments).(Name)
    • Formatting, orientation = To Objects
    • Formatting, Y Offset = -0.5

    3.      Label Feature Line and Polyline Layers (*Feature Line Layer.lg / Polyline Layer.lg)

    Continuing the theme of adding some labels to corridor target objects, we can label feature line (and polylines) layer names at intervals. For feature lines, you may want to switch the Contents to the feature line’s name instead of the layer name – depending on how you like to use feature lines.

    • Label Type = Multiline Text
    • Anchor Object = Feature Lines (Layer filter = *)
    • Anchor Point = Vertices (Interval = 100, rest unchecked)
    • Formatting, contents = (Feature Lines).(Layer)
    • Formatting, orientation = To Objects
    • Formatting, Y Offset = -0.5

    If you have a lot of polylines for use for horizontal target condition subassemblies, you can label those as well, to make it easier to see what layer names they have. They tend to be shorter, so instead of intervals, midpoints might be more appropriate.

    • Label Type = Multiline Text
    • Anchor Object = Feature Lines (Layer filter = *)
    • Anchor Point = Vertices (Interval = 100, rest unchecked)
    • Formatting, contents = (Feature Lines).(Layer)
    • Formatting, orientation = To Objects
    • Formatting, Y Offset = -0.5

    Labelling for Presentation (*Presentation.dwg)

    Sometimes, we need to fill in some objects in the drawing for conceptual presentation. At the conceptual stage, we can forego precise placement and mass populate objects such as trees, lights, and structures quickly. These objects, in turn, can be exported to InfraWorks for even greater visual impact.

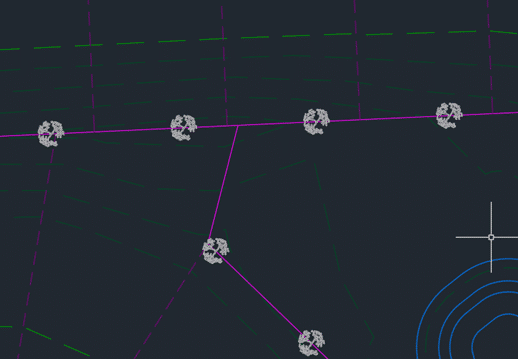
    4.      Place Tree Blocks at Back of Lots (*Place Trees.lg)

    First, we can place some trees at an interval at the back lot line.

    • Label Type = Blocks
    • Anchor Object = Feature lines (Layer filter = _LOTS BACK, C-PROP-BNDY)
    • Vertices = Interval 60
    • Format, Block Definition = Deciduous Tree
    • Format, Scale = 60

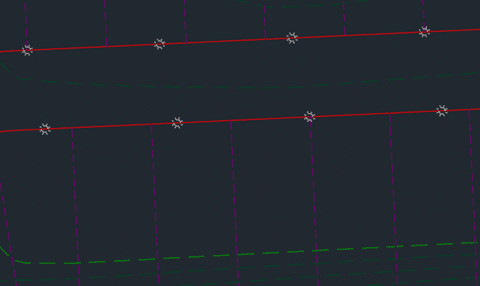
    5.      Place Lights (*Place Lights.lg)

    Lights are place along the right of way with an offset at intervals.

    • Label Type = Blocks
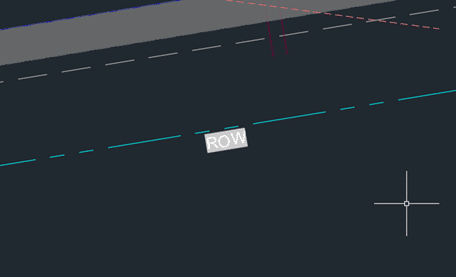
    • Anchor Object = Feature Lines (Filter = *ROW*)
    • Anchor Point = Vertices (Interval 100)
    • Formatting, Block Definition = SL
    • Formatting, Scale = 30


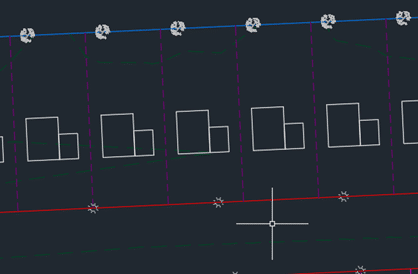
    6.      Place Building Footprints (*Place House.lg)

    Next, we can place some house block representing structure footprints in lots.

    • Label Type = Blocks
    • Anchor Object = manually select a row of side lot lines at the North end of subdivision
    • Anchor Point = Vertices (Begin of Object)
    • Formatting, Block Definition = House
    • Formatting, Scale = 0.8
    • Formatting, Orientation = To Object
    • Formatting, Rotation/X Offset/Y Offset = 270 / 40 / 30

    Measuring and Quantifying (*Measure and Quantify.dwg)

    7.      Dimension a Building (*Dimension Building.lg)

    We can automatically apply dimensions to objects using the Label Genie. Let’s try it on a building footprint.

    • Label Type = Dimensions
    • Anchor Object = Polylines (Layer filter = A-BLDG)
    • Anchor Point: Segments
    • Formatting, style = Annotative
    • Formatting, annotative = checked on
    • Formatting, Orientation = To Object
    • Formatting, Rotation / X Offset / Y Offset = 0 / 0 / -8

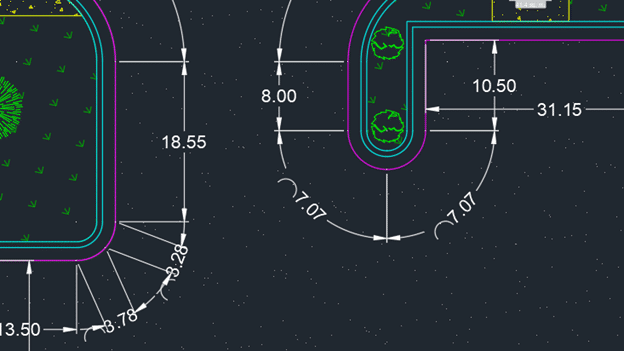
    8.      Dimension Curb (*Dimension Curb.dwg)

    We can dimension curb feature lines as well. Key to success is consistent stationing direction – always counter-clockwise or clockwise.

    • Label type: dimensions
    • Anchor object: feature lines (Layer filter = C-PRAVE-CURB-EOA)
    • Anchor point: segments
    • Formatting, style = annotative
    • Formatting, orientation = to object
    • Formatting, rotation / x offset / y offset = 0 / 0 / -8

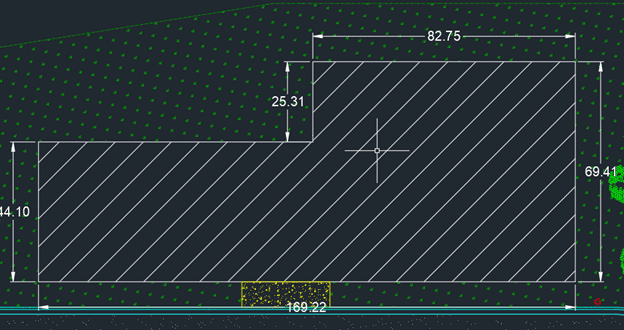
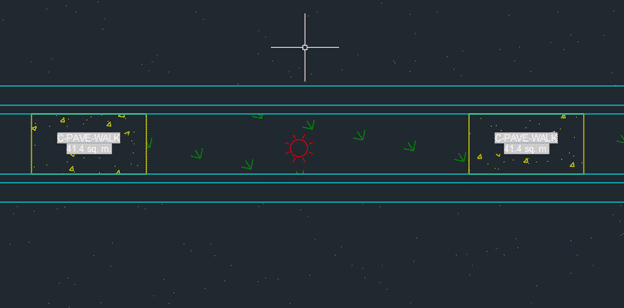
    9.      Measure Areas (*measure areas.lg)

    Next, we generate area quantity labels for various hatching in the drawing. Note that labels are created in the centroids of hatches. This means that if you have an “L” shaped hatch, such as the grass in this drawing, the label may end up being outside the hatch. Some manual repositioning may be required.

    • Label Type = MultilineText
    • Anchor Object = Hatches (layer filter = *)
    • Anchor Point = Centroid
    • View Type = Plan
    • Formatting contents =
      • (Hatches).(Layer)
      • <New Line>
      • (Hatches).(Area)
        • Field customization: Format = Decimal, Precision = 0.0, Suffix = sq. m.
      • Formatting, Style = Annotative
      • Formatting, display width = 12

    More Labelling Tips On the Way

    That concludes the first 9 of the 15 time-saving shortcuts using the CTC Label Genie. It can help us quickly generate labels that can help us find the design information we need, place blocks to flesh out a conceptual design drawing, and dimension and measure various objects.

    Keep an eye out for Part 2, where we cover locating points and objects, as well as communication key surface information.

    *Please email us at info@solidcad.ca to request the data sets.

    Civil 3D 2022.0.1 CIM Suite Tools Updates from CTC

    We are excited to announce that our partner CTC Software released Civil 3D CIM Project and Manager Suites, version 22.0.1. It is now released and can be accessed on the CTC website.

    This update saw a lot of fixes and enhancements to new products released in 22.0.0 and before.

    Below are release notes:

    22.0.18/17/2021CIM Project SuitePipe PlannerBug FixFixed a variety of issues causing Pipe Planner to error out or crash. Improved application speed performance. Fixed issues with exporting to external spreadsheets. Fixed issues with importing external spreadsheets.
    22.0.18/17/2021CIM Project SuitePipe PlannerEnhancementAdded support for formulas in user-defined empty columns and rows. Added properties filter search bar. Added interactive selection of export starting cell. Improved part renaming, allowing old names to be reused on new part names within the same operation. Added new right-click options to edit the middle table. Misc. enhancements and performance improvements.
    22.0.18/17/2021CIM Project SuitePipe DesignerEnhancementImproved part renaming, allowing old names to be reused on new part names within the same operation.
    22.0.18/17/2021CIM Project SuiteLabel GenieEnhancementAdded option to manually select anchor objects in drawings.  Added option when labeling layouts to create a unique layer for each layout.
    22.0.18/17/2021CIM Project SuiteLabel GenieBug FixFixed an issue where layout-specific labeling was not respecting exact viewport extents.  Fixed an issue where segment labels were not following the assigned layer. Fixed misc. issues with specific drawing files.
    22.0.18/17/2021CIM Project SuiteEarthwork ProcesserBug FixFixed an issue where errors occurred if existing or proposed surfaces were empty or not overlapping one another.  Fixed an issue where earthwork region polylines that were significantly small would not offset and cause the app to error.
    22.0.18/17/2021CIM Project SuiteData WizardBug FixFixed an issue where survey figures caused Data Wizard to error.
    22.0.18/17/2021CIM Project SuiteParts SwapperBug FixFixed an issue where parts not found in the parts catalog were causing Parts Swapper to file.
    22.0.18/17/2021CIM Project SuiteCorridor MapperBug FixFixed an issue where changes to assemblies would cause the app to error.
    22.0.18/17/2021CIM Project SuiteCIM Project SuiteBug FixFixed an issue where custom subassemblies were breaking when CIM Project Suite was installed.
    22.0.18/17/2021CIM Manager SuiteTemplate TrackerBug FixFixed an issue where pressure network band styles were causing Template Tracker to error out.
    22.0.18/17/2021CIM Manager SuiteCIM Manager SuiteBug FixFixed an issue where custom subassemblies were breaking when CIM Manager Suite was installed.