Leverage Jupyter Notebook for Reporting on your BIM360/ACC Environment
Introduction
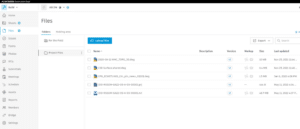
Autodesk Construction Cloud (ACC) (see Figure 1) is a cloud-based application that allows design teams to manage their drawings and building models in a centralized way. ACC has a well-defined Restful (REST) API interface that makes it easy to extract and report on all manner of operational information. Using Python, Jupyter Notebook, and some ubiquitous Python libraries it is quite simple to create a customizable dashboard that can be leveraged on-demand by BIM Managers and IT Admins alike.
Figure 1 – Autodesk Construction Cloud
What do you need?
So what do we need to know in order to get started? To prepare you will need access to Autodesk Construction Cloud, which I won’t cover here, and of course a Forge account that will allow you to setup and connect an application to your ACC hub. You can find more information on setting up a forge application in this link. Secondly, you will need to install Anaconda which is a powerful Python based data science platform that allows users to easily install and run a wide variety of Python libraries. Once you install Anaconda, you will need to install a few libraries including the following:
- requests –allows users to make HTTP calls to cloud services;
- json – allows users to serialize the resulting Json to easily access attributes;
- matplotlib – allows users to create rich data visualizations such as graphs (Matlab);
- pandas – provides users with several useful data management tools; and
- datetime plus dateutil – which allows us to easily perform date functions such as time zone conversion.
You can find more information on installing Anaconda at this link.
Finally, you will need to create a new Anaconda environment (see link) and install the libraries listed above along with Jupyter Notebook. Jupyter Notebook can be installed from the Anaconda prompt with the following:
(env) PS C:\user> conda install jupyter notebook
Once Jupyter Notebook is installed you can simply type jupyter notebook at the command prompt and hit enter to open the console in a new browser window or tab. (see Figure 2)
Figure 2 – Jupyter Notebook Starting Page

The starting page provides access to all the notebooks in your development environment.
One more thing before you get started, you will need to set up an application in Autodesk Forge. You will then attach that application to your ACC instance so you can access the information through the REST API. More instructions on setting this up can be found by following this link.
Creating a Dashboard
A dashboard is intended to be a simple graphical data-driven interface that provides a window into operational activities and events. The dashboard must be two things
- simple to understand; and
- relevant
Some thought should be given to what you want to report on but some examples are
- drawing type distribution statistics which provide some insight into software usage; and
- user role distribution statistics which provide insight into who is doing what.
Once you have determined what you are going to report on, you can then start building your notebook.
Building and Organizing Your Notebook
Jupyter Notebook allows users to structure their code into cells which provides a way to step through your code. This is very important for debugging as you can easily isolate sections of code which provides better code management.
You can start by importing all relevant Python libraries. (see Figure 3)
Figure 3 – Import Python libraries to extend the functionality of the core Python environment

Once the correct libraries are imported to the Jupyter Notebook session you can start setting up the appropriate properties starting with the authorization call. (see Figure 4)
Figure 4 – Parameters to be used for collecting authorization token

These parameters are then used in an HTTP call using the request library to return the appropriate authorization token. Note: you must set up the correct scope(s) to ensure the permissions you have when the REST API is called are adequate. Some example scopes are as follows:
- data:read
- data:write
- data:create
However, there are many others, which you can find out more about by visiting this link.
Collecting the Data
Now you can collect the appropriate data for your dashboard. To do this you will need to find the correct REST Endpoints. Some of the endpoints used for this demonstration are:
Using these endpoints, you can simply leverage the request Python library functions to retrieve the data
- users = requests.get(url, data=data, headers=auth)
The json Python library can be used to serialize the resulting “user” object for easy access to the data attributes.
- json = json.loads(users.text)
Now you can iterate through the json object and populate python lists to create a “data table” object. Those data table objects can then be simply plugged into any number of data visualization objects such as a pandas dataframe or a Matlab graph.
Visualizing the Dashboard
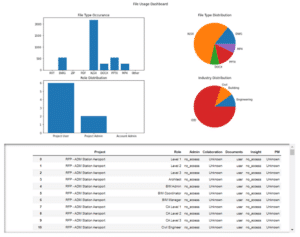
So now you have the data to visualize, how do you get it into a dashboard? Now you can leverage the final Python library of this demo, matlibplot. This library allows users to plug the lists of data created above into several different graphical representations. Figure 5 illustrates a set of graphic plots created with matlibplot (Matlab) as well as a data table produced from a pandas data frame. You can see that these graphical data objects can be organized into a meaningful dashboard that can be reused and even shared with others in your organization.
Figure 5 – Jupyter Notebook Dashboard with Data Frame Table
Development and Sharing
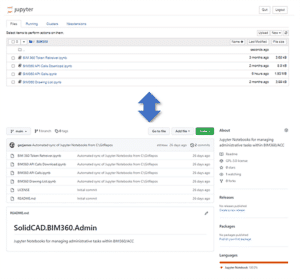
A brief word on sharing these dashboards throughout the organization and for tracking development of the notebooks. It is very simple to publish these notebooks to a GitHub repository (see Figure 6) that will allow other users to access the notebooks as permitted. GitHub can also track versions of the different notebooks to make it possible to go back in time to find previous code which makes it easier to do code trials. You can also create different code branches that allow multiple developers to work on the notebooks simultaneously.
To do this you will need to create a GitHub repository, load your notebooks to that repository and then clone the repository to your local machine. Once you have the notebooks in a local repository, you can set the custom location for your notebooks to that repo by accessing the configuration file, typically located at C:\Users\<username>\.jupyter\jupyter_notebook_config.py and then updating the line that starts c.NotebookApp.notebook_dir = by adding the location of your notebook repo to the end. This will ensure the start page shows your development repository.
Figure 6 – Committing Jupyter Notebooks to GitHub
There are a few ways that you can synchronize your notebook location to GitHub. Of course, you can do it manually but accessing the repository from the web interface, or you can install GitBash (see Figure 7) for windows and perform the repository functions by command line or batch file.
Figure 7 – GitBash for Windows

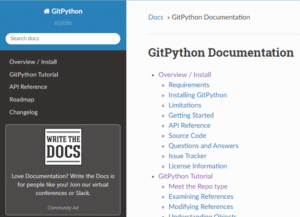
Finally, you can create your own utility to do the synchronization in a more directed way. There are a variety of Python libraries such as PyGithub or GitPython that can help create your own Jupyter Notebook to synchronize your notebooks with GitHub. (see Figure 8)
Figure 8 – GitPython Python Library for working with GitHub
Other Use Cases
While the use of Jupyter Notebook and Python as tools to generate meaningful reports, there are many other uses that could be investigated. I personally work with many clients to develop ETL (extract, transform, load) strategies to bring mission-critical data into their hosted and cloud environments. Part of this process almost always requires some Python coding to perform tasks the OOB (out of the box) software cannot do. I find Jupyter Notebook an extremely powerful IDE for doing code development, allowing me to perform debugging and quality control activities without a lot of software knowledge. Additionally, Python can be used to access other cloud-based platforms with a REST API such as Fusion 360 Manage which is Autodesk’s primary PLM (product lifecycle management) platform. Jupyter Notebook could be a way to report on content in this platform as well as extend the functionality to ensure implementations of these frameworks are successful.
Conclusion
BIM and IT managers are tasked with ensuring the efficient flow of data through their organizations’ design and engineering processes. This requires easy access to any number of information products including usage, data, and role statistics. Python can easily be accessed through the Jupyter Notebook interface and, in conjunction with the ACC REST API, provides a very useful tool for any BIM or IT manager to report on these items.
The scripts can be created to be very flexible and easily shared, allowing users to pass their own information into the process and create rich dashboards for business and engineering analytics. The ACC and BIM 360 APIs are very well documented so anyone with a bit of understanding of REST and Python can get started creating these products. Together, these are very flexible and powerful frameworks for collecting data from cloud services and for reporting on current environmental conditions.


