• Canadian Flag Proudly Canadian Owned and Operated
  • Civil 3D 2023.1 Update

    Autodesk has released the Civil 3D 2023.1 update.  Use the Desktop App to install it or download it from your Autodesk AccountClick here to find out what’s new and what’s been fixed. Please note that you must first install the AutoCAD 2023.1 update.

    Most of the enhancements are centered around Autodesk Docs features.


    Fixed Issues

    Autodesk Trust Center

    For the latest information regarding the security fixes in this Update, refer to the Security Advisory:

    ADSK-SA-2022-0014

    ADSK-SA-2022-0016

    Problems Reported Through the Customer Error Reporting Utility

    As a result of the detailed information that we received from customers who used the Customer Error Reporting Utility, we were able to identify and fix several defects including the following:

    Graphics

    Occasional crashes when selecting some objects with BLEND commands under “Shaded (Fast)” visual style.

    Occasional crashes when switching to “Shaded (Fast)” visual style in some drawings.

    Occasional crashes when launching AutoCAD on some machines with few specific graphic drivers.

    General

    Occasional crashes when opening and then saving some specific drawings.

    Occasional crashes when using PASTESPEC to copy Microsof Excel table into the drawing.

    General Update Content

    The following defects have been fixed:

    Display

    When you turn on/off layers, the objects in the drawing are reflected correctly.

    The dimension preview now displays under “Shaded (Fast)” visual style.

    The 3D objects can rotate correctly on the expected location when orbiting through 3D gizmo under “Shaded (Fast)” visual style.

    Bold and italic formatting in MTEXT now works as expected under “Shaded (Fast)” visual style.

    Markup Import and Markup Assist

    The Markup Assist boundary displays correctly when holding the wheel to pan on one of the locked viewports.

    The Markup geometry keeps the uneditable status after using the TRACEBACK command.

    Pressing the Esc key now cancels the Markup Import process.

    The imported images keep the embedding status after the Markup import is completed.

    Performance

    Improved performance when plotting a file with the raster image pasted and setting “Background Transparency” to Yes.

    Improved performance when orbiting the drawing containing multiple leaders with SHIFT+middle mouse button under “Shaded (Fast)” visual style.

    Improved performance on Hatch pattern previews on the ribbon drop-down list.

    Trace

    The Markup entity can be recognized successfully after undoing the new trace creation.

    The “Trace – Name Already Exists” message now displays when there is a duplicate trace name.

    Sheet Set Manager with Autodesk Docs

    The Edit button on the Sheet Set Manager for Web palette automatically adapts the palette width.

    The expand status on Sheet Set Manager for Web palette is now kept when switching the color theme in AutoCAD.

    The cloud DST file is now recorded on the Recent documents list.

    User Interface

    Drop-down lists now display clearly in certain dialog boxes in Windows 11.

    The QVLAYOUT thumbnail previews can be hidden automatically when selecting one of the layout previews.

    The underscore in the action macro name on the Action Recorder panel now shows in the drop-down list.

    The Close button now displays completely on the top-right side of the Start tab.

    The scroll bar and icons now show correctly in the Recent tab when setting display scale to certain values.

    An error message has been fixed when pressing the Esc key to close “Sort” pop-up list on the Start tab.

    Any layer can now be dragged into a Layer group filter in Windows 11.

    General

    TRIM and HATCH now recognize the edges of Civil 3D objects.

    All copied dimensions now appear at their specified locations correctly when associative dimension is copied multiple times.

    OLE objects now display correctly in Windows 11.

    Commands can now be entered immediately after switching layouts between multiple layouts.

    The renaming function in the Sheet View Category on the Sheet Set Manager is now implemented successfully.

    The Explode option on the Blocks palette is now retained after relaunching AutoCAD.

    The OVERKILL command behavior is now consistent with legacy products.

    Some specific STEP files are now imported correctly into AutoCAD.

    MLEADER objects converted from multiple text objects can now be set to a correct Z value.


    Parent page: AutoCAD Updates

    Why BIM in AEC Firms?

    What is BIM? Why BIM Adoption?

    Is your existing workflow process seamless?

    Is there repetition or duplication of effort?

    Is data being re-enter from time to time?

    How do you handle changes?

    How many tools do you have to use to resolve that change order?

    Here are the sources of over-budgeting in operations and late project deliverables:

    • Poor collaboration
    • Low productivity
    • Low quality result
    • Overtime
    • Rework loads

    Building Information Modelling (BIM) is a powerful technology implemented by many leading countries over the last 20 years. Canada remains the only G7 country without a national BIM mandate.    –Government, Technology, Daily Commerical News

    If you want to understand and learn more about BIM Implementation and approach, we have a great team of experts supporting individuals and organizations in terms of BIM training and helping them to set up a strong foundation project to reach independence. SolidCAD has many successful cases in thriving BIM implementation in various cases.

    Please feel free to reach out to me at shirley.sio@solidcad.ca for more information.

    #WhatisBIM #BIMadoption #SolidCAD #AECindustry #Digitaltwin #digitaltransformation #BIMmandate

    Leverage Jupyter Notebook for Reporting on your BIM360/ACC Environment

    Leverage Jupyter Notebook for Reporting on your BIM360/ACC Environment

    Introduction

    Autodesk Construction Cloud (ACC) (see Figure 1) is a cloud-based application that allows design teams to manage their drawings and building models in a centralized way.  ACC has a well-defined Restful (REST) API interface that makes it easy to extract and report on all manner of operational information.  Using Python, Jupyter Notebook, and some ubiquitous Python libraries it is quite simple to create a customizable dashboard that can be leveraged on-demand by BIM Managers and IT Admins alike.

    Figure 1 – Autodesk Construction Cloud 


    What do you need?

    So what do we need to know in order to get started?  To prepare you will need access to Autodesk Construction Cloud, which I won’t cover here, and of course a Forge account that will allow you to setup and connect an application to your ACC hub.  You can find more information on setting up a forge application in this link.  Secondly, you will need to install Anaconda which is a powerful Python based data science platform that allows users to easily install and run a wide variety of Python libraries.  Once you install Anaconda, you will need to install a few libraries including the following:

    • requests –allows users to make HTTP calls to cloud services;
    • json – allows users to serialize the resulting Json to easily access attributes;
    • matplotlib – allows users to create rich data visualizations such as graphs (Matlab);
    • pandas – provides users with several useful data management tools; and
    • datetime plus dateutil – which allows us to easily perform date functions such as time zone conversion.

    You can find more information on installing Anaconda at this link.

    Finally, you will need to create a new Anaconda environment (see link) and install the libraries listed above along with Jupyter Notebook.  Jupyter Notebook can be installed from the Anaconda prompt with the following:

    (env) PS C:\user> conda install jupyter notebook

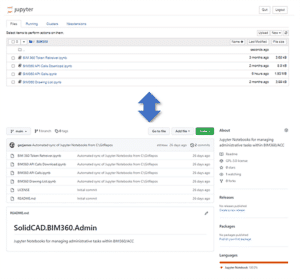
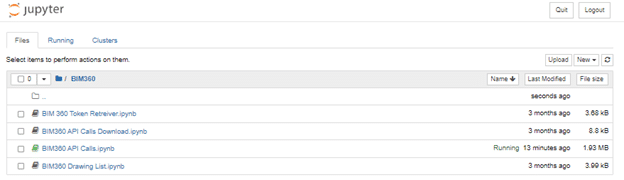
    Once Jupyter Notebook is installed you can simply type jupyter notebook at the command prompt and hit enter to open the console in a new browser window or tab. (see Figure 2)

    Figure 2 – Jupyter Notebook Starting Page

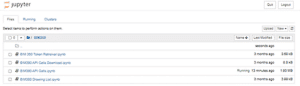
    The starting page provides access to all the notebooks in your development environment.

    One more thing before you get started, you will need to set up an application in Autodesk Forge.  You will then attach that application to your ACC instance so you can access the information through the REST API.  More instructions on setting this up can be found by following this link.

    Creating a Dashboard

    A dashboard is intended to be a simple graphical data-driven interface that provides a window into operational activities and events.  The dashboard must be two things

    1. simple to understand; and
    2. relevant

    Some thought should be given to what you want to report on but some examples are

    • drawing type distribution statistics which provide some insight into software usage; and
    • user role distribution statistics which provide insight into who is doing what.

    Once you have determined what you are going to report on, you can then start building your notebook.

    Building and Organizing Your Notebook

    Jupyter Notebook allows users to structure their code into cells which provides a way to step through your code.  This is very important for debugging as you can easily isolate sections of code which provides better code management.

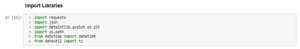
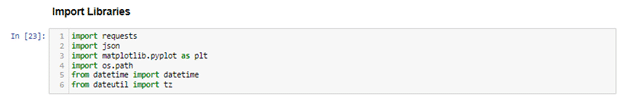
    You can start by importing all relevant Python libraries. (see Figure 3)

    Figure 3 – Import Python libraries to extend the functionality of the core Python environment


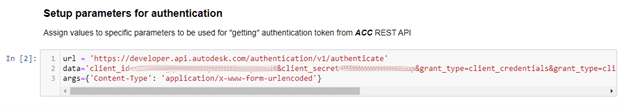
    Once the correct libraries are imported to the Jupyter Notebook session you can start setting up the appropriate properties starting with the authorization call. (see Figure 4)

    Figure 4 – Parameters to be used for collecting authorization token

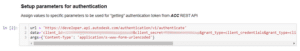
    These parameters are then used in an HTTP call using the request library to return the appropriate authorization token.  Note: you must set up the correct scope(s) to ensure the permissions you have when the REST API is called are adequate.  Some example scopes are as follows:

    • data:read
    • data:write
    • data:create

    However, there are many others, which you can find out more about by visiting this link.

    Collecting the Data

    Now you can collect the appropriate data for your dashboard.  To do this you will need to find the correct REST Endpoints.  Some of the endpoints used for this demonstration are:

    Using these endpoints, you can simply leverage the request Python library functions to retrieve the data

    • users = requests.get(url, data=data, headers=auth)

    The json Python library can be used to serialize the resulting “user” object for easy access to the data attributes.

    • json = json.loads(users.text)

    Now you can iterate through the json object and populate python lists to create a “data table” object.  Those data table objects can then be simply plugged into any number of data visualization objects such as a pandas dataframe or a Matlab graph.

    Visualizing the Dashboard

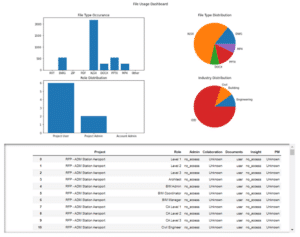
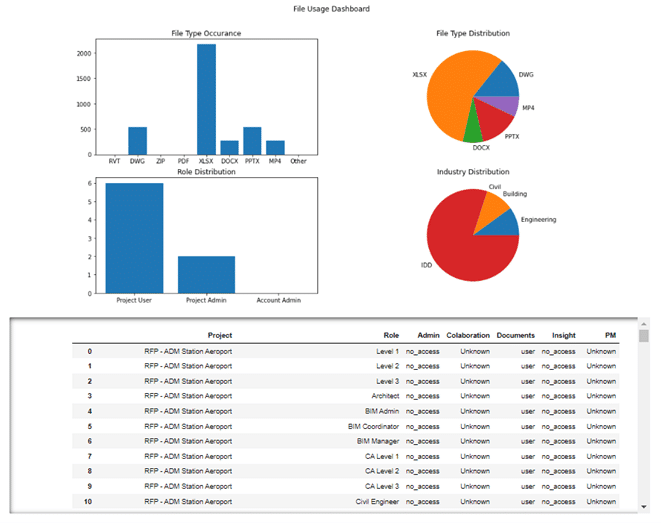
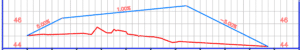
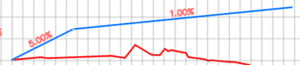
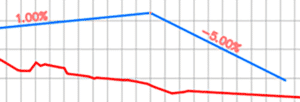
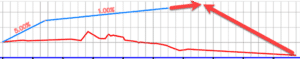
    So now you have the data to visualize, how do you get it into a dashboard?  Now you can leverage the final Python library of this demo, matlibplot.  This library allows users to plug the lists of data created above into several different graphical representations.  Figure 5 illustrates a set of graphic plots created with matlibplot (Matlab) as well as a data table produced from a pandas data frame.  You can see that these graphical data objects can be organized into a meaningful dashboard that can be reused and even shared with others in your organization.

    Figure 5 – Jupyter Notebook Dashboard with Data Frame Table

    Development and Sharing

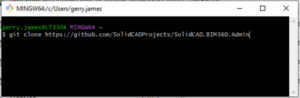
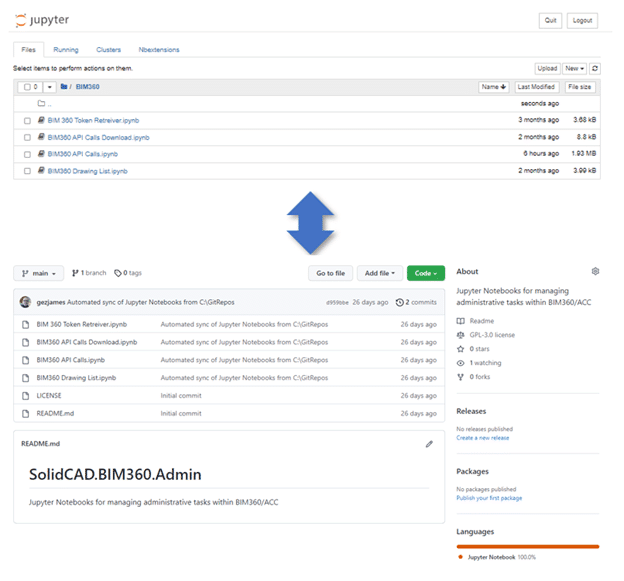
    A brief word on sharing these dashboards throughout the organization and for tracking development of the notebooks.  It is very simple to publish these notebooks to a GitHub repository (see Figure 6) that will allow other users to access the notebooks as permitted.  GitHub can also track versions of the different notebooks to make it possible to go back in time to find previous code which makes it easier to do code trials.  You can also create different code branches that allow multiple developers to work on the notebooks simultaneously.

    To do this you will need to create a GitHub repository, load your notebooks to that repository and then clone the repository to your local machine.   Once you have the notebooks in a local repository, you can set the custom location for your notebooks to that repo by accessing the configuration file, typically located at C:\Users\<username>\.jupyter\jupyter_notebook_config.py and then updating the line that starts c.NotebookApp.notebook_dir = by adding the location of your notebook repo to the end.  This will ensure the start page shows your development repository.

    Figure 6 – Committing Jupyter Notebooks to GitHub

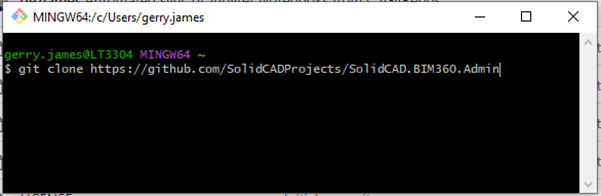
    There are a few ways that you can synchronize your notebook location to GitHub.  Of course, you can do it manually but accessing the repository from the web interface, or you can install GitBash (see Figure 7) for windows and perform the repository functions by command line or batch file.

    Figure 7 – GitBash for Windows

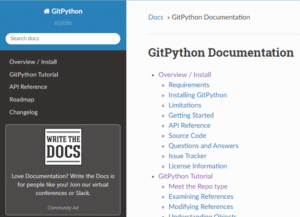
    Finally, you can create your own utility to do the synchronization in a more directed way.  There are a variety of Python libraries such as PyGithub or GitPython that can help create your own Jupyter Notebook to synchronize your notebooks with GitHub. (see Figure 8)

    Figure 8 – GitPython Python Library for working with GitHub

    Other Use Cases

    While the use of Jupyter Notebook and Python as tools to generate meaningful reports, there are many other uses that could be investigated.  I personally work with many clients to develop ETL (extract, transform, load) strategies to bring mission-critical data into their hosted and cloud environments.  Part of this process almost always requires some Python coding to perform tasks the OOB (out of the box) software cannot do.  I find Jupyter Notebook an extremely powerful IDE for doing code development, allowing me to perform debugging and quality control activities without a lot of software knowledge.  Additionally, Python can be used to access other cloud-based platforms with a REST API such as Fusion 360 Manage which is Autodesk’s primary PLM (product lifecycle management) platform.  Jupyter Notebook could be a way to report on content in this platform as well as extend the functionality to ensure implementations of these frameworks are successful.

    Conclusion

    BIM and IT managers are tasked with ensuring the efficient flow of data through their organizations’ design and engineering processes.  This requires easy access to any number of information products including usage, data, and role statistics.  Python can easily be accessed through the Jupyter Notebook interface and, in conjunction with the ACC REST API, provides a very useful tool for any BIM or IT manager to report on these items.

    The scripts can be created to be very flexible and easily shared, allowing users to pass their own information into the process and create rich dashboards for business and engineering analytics.  The ACC and BIM 360 APIs are very well documented so anyone with a bit of understanding of REST and Python can get started creating these products.  Together, these are very flexible and powerful frameworks for collecting data from cloud services and for reporting on current environmental conditions.

    AutoCAD 2023.1 Update

    Autodesk has released the 2023.1 updates.  Use the Desktop App to install it or download it from your Autodesk AccountClick here to find out what’s new.  Additionally, the 2023.0.1 update is also available.

    This release includes new and updated features, performance enhancements, and fixes for Autodesk® Civil 3D® 2023. It is strongly recommended that you read this entire document before installing.

    Note: AutoCAD 2023 Update 1 must be installed before Civil 3D 2023 Update 1. AutoCAD 2023 Update 1 cannot be uninstalled independently. To remove the update, you must reinstall Civil 2023.0.

    New Features

    Find out about the new and improved features in the Autodesk Civil 3D 2023.1 release.

    Fixed Issues

    Find out what issues have been fixed in Autodesk Civil 3D 2023.1.

    Known Issues

    Find out about known issues in Autodesk Civil 3D 2023.1.

    Installation

    Detailed installation information can be found in the Autodesk Civil 3D installation help topics.

    • It is recommended that you first install all Microsoft® Windows® updates prior to installing Autodesk Civil 3D 2023.1.
    • Please close all applications prior to installing Autodesk Civil 3D 2023.1.
    • Autodesk Civil 3D 2023.1 can be installed side-by-side with prior versions of Autodesk Civil 3D.
    • If your team works in a multi-seat stand-alone environment, you can repeat this basic installation process for each computer seat. Alternatively, an administrator can create a deployment.

    The Top 5 Reasons to Use Quantity Link in Revu

    This story was originally published  on the Bluebeam Blog.

    Let’s do a quick flashback to show a feature in Bluebeam Revu you might not be aware of, although it’s been around for several years.

    One of my favorite releases of Revu came in 2017, when the company’s developers introduced several enhanced measurement tools allowing intelligent material takeoff workflows. How great is it when you can simply highlight the length of a beam and it automatically calculates and provides totals? Or using Dynamic Fill to find area measurements by pouring paint on a floorplan to fill the room or space?

    My all-time favorite feature, however, is Quantity Link.

    With this tool, Revu users are able to link Microsoft Excel files directly to the markups in a PDF drawing. As you might already know, the totals in Revu are calculated in the Markups List. Quantity Link, however, takes the information a little further. As you measure materials in Revu, the measurement or quantity totals are simultaneously updating in the connected Excel spreadsheet.

    Onboard teams with Bluebeam

    What exactly does that mean? Here are the top five benefits of using Quantity Link in your workflows.

    Presentations: Whether you’re a developer presenting to a city or a city presenting to the public, visual, numerical data can be extremely important. When creating land use presentations for a new development, you can have your visual graphs update automatically, painting a clear picture of design intent.

    Legacy Spreadsheets: Most specialty contractors have an existing spreadsheet they use for estimates. Those spreadsheets are one of the reasons you’re successful; why give them up when you can connect them to markups in Revu? Even if the spreadsheets aren’t rich with formulas, they can be created to match the requirements of your estimating software, allowing you to simply import.

    Easily Update Revisions: Once you have all your markups in place collecting quantities, it’s really easy to simply update the existing markups when a revision comes in rather than starting over. With features like Document Compare and Overlay Pages, Revu will pinpoint exactly where changes were made so you can instantly update your markup and the spreadsheet at the same time. This also paints a pretty good picture for scope creep, justifying additional materials, schedule changes and labor.

    Civil 3D: Plan Production Styles

    Do you use Civil 3D’s plan production tools?  Do you wonder where the styles come from, the design file, the production template?  Read on to find out.

    If you’re not familiar with Civil 3D’s plan production tools, here are the Cole’s notes.

    • Paper space layouts complete with your company’s title block and plan and/or profile viewports are created automatically along the entire length of a selected alignment.
    • A plan production template must be selected which contains a layout configured for use with this feature.
    • These layouts can be created in one of three places:
      • In the current drawing.
      • In new drawings, one layout per drawing.
      • All layouts in a single new drawing.

    When the option to create layouts in a single new drawing or multiple drawings is chosen, there are three files in play.

    • The design file
    • The selected plan production template
    • The production sheet file the tool creates

    Both the design file and the selected template can contain styles.  They could be the same styles, or they may be different.  When creating the new drawings, which of these two files does Civil 3D use as the template: the starting point?  Where do the styles and settings come from?

    The answer is both, sort of.  Here is what happens:

    1. Civil 3D uses the design file as the template.  All styles and settings come from this file.
    2. Any styles present in the production template are then duplicated into the new production sheet drawing.
    3. If there are any styles in the production template that are the same name as the design file, they are ignored.  The design file styles are maintained.

    Note that Style 3 is present in the Design and Template files.  In the Sheet file, Style 3 is the same as the Design file.

    Civil 3D: Profile Grade Intersections

    The goal in this example is to design the profile where each grade is an even number.  It’s not as obvious as you might think.  Thanks to my colleagues Dave Hill and Jae Kwon for pointing out the proper tool.

    Read on to learn more…

    Begin by modelling the first 2 segments.  I’ll assume you know the best tools for this, but I’ll give you a hint.  Use the Grid View; it’s your friend here.


    To model the last 5% grade is not entirely obvious.  Yes, a 5% tangent can be drawn from the end of the 1% grade, but it doesn’t end in the right place.

    We sort of want to draw backwards from the end of the red profile and then extend the 1% grade.

    Use this tool and follow the prompts.  First select the 1% grade, then pick Station and Elevation and the tie-in point.  Then enter the grade, in this case -5% (the grade from the intersected PVI).


    C’est voilà.


    Civil 3D: Model Existing Underground Utilities Efficiently

    Civil 3D: Model Existing Underground Utilities Efficiently

    Must you draw existing gas, tel, and other similar underground utilities for your projects?  If you’re not using the technique described below, you’re using too much time!  Read on to find out more.

    Join us at Infrastructure University, session 3, on October 20th for more information about this technique. For now:

    Facts:

    1. For nearly every civil engineering project, we must identify existing features on our construction drawings so they may not be disturbed during construction and so we may design proposed works without conflicting with these existing features. They must appear in both plan and profile.
    2. It can take considerable time to draw and label them in the plan, and even more project them into profile.
    3. When there is an edit to the alignment, the profile locations must be recalculated, taking more time.
    4. Experiments have shown that it can take 84 seconds to draw each utility. Then 26 more seconds each when the alignment is edited.
    5. Using the technique described below, the time is reduced from 84 seconds to 20 seconds. But 0 seconds when the alignment is edited.
    6. For 160 utilities:
      1. 3.7 hours using the manual technique.                   69 minutes each time the alignment is edited.
      2. 53 minutes using the automated technique.         No extra time when the alignment is edited.

    Method

    1. Create pressure network parts lists, one for each utility. Assign styles accordingly.
    2. Create pressure networks, one for each utility. Assign the parts list and label styles accordingly.
    3. Model the existing utilities as pressure networks and project them into profile. The depth below ground can be automated.

    Civil 3D: Pipes not Extending to Structures

    Have you seen this before?  This is how Civil 3D’s pipes sometimes appear before and after the current annotation scale has been changed.  Not good.

    Read on to learn more…

    What is the cause?  This setting in the structure style.  You will find it in the Plan tab in the style editor.

    How to fix this?  There are several methods.

    • Never change the scale!  Easy to say, not so easy to implement.
    • Turn off that setting.  Problem is, you get this.

    • Swap each structure.  Choose the same structure.  What if there are 200 of them?  Too much time.

    • Grip-edit each structure and move them back onto their original positions.  Same problem as previous, too much time.
    • Add a wipeout to the block being used AND turn off that setting.  Our first real potential solution.  Some users report black blobs when printing to PDF when using wipeouts, however.
    • Use Project Explorer.  Select all the structures, right click, and choose the following option.  Then just click OK.  This kicks the structures in the butt and the pipes extend themselves properly.  Of course, next time the scale is changed, this must be redone but this only takes about 5 seconds.

    I prefer the wipeout option because it is permanent.  No other workarounds necessary.  If this is not an option for you, then the Project Explorer trick is likely the best option.

    Bluebeam Transition to Subscription

    null

    Bluebeam Transition to Subscription

    Starting September 20th, 2022, Bluebeam is Moving from Perpetual Standalone Licensing to Subscription 

    New subscription packages:

    • Bluebeam Basics
    • Bluebeam Core
    • Bluebeam Complete

    Benefits of Subscription:

    • Work anywhere with Bluebeam Revu Desktop and Bluebeam Cloud
    • Better manage and administer licenses across entire organization
    • Global rights – use in any country
    • Access to Bluebeam Desktop Revu v21 & Bluebeam Cloud and future releases/updates
    • Bluebeam University included for free
    • Use work, home or in the field and on any device under one Bluebeam
    • Named-Users model – login with Bluebeam ID (BBID) or supported single sign-on (SSO) provider (Okta AD or Microsoft Azure AD)
    Policy Update: VALID ORDERS MUST BE SUBMITTED TO BLUEBEAM PRIOR TO
    JANUARY 31, 2023
     

    Bluebeam will allow Perpetual Paid Upgrades if active Maintenance is purchased. Existing customers without active Maintenance will NOT be allowed to purchase a Paid Upgrade to Perpetual ONLY. Customers without active Maintenance must purchase a Paid Upgrade and Maintenance simultaneously; they will then would be in the normal pool of customers with active maintenance.

    Customers must purchase active Maintenance with their Paid Upgrade to Revu 20. Once a customer upgrades to Revu 20, they will be able to add new Perpetual seats until September 30, 2023


    Contact your sales rep to learn more about the transition to subscription and available plans!

    Contact

    null